



Last updated: July 1, 2026
Custom dashboard development: process, benefits and ROI
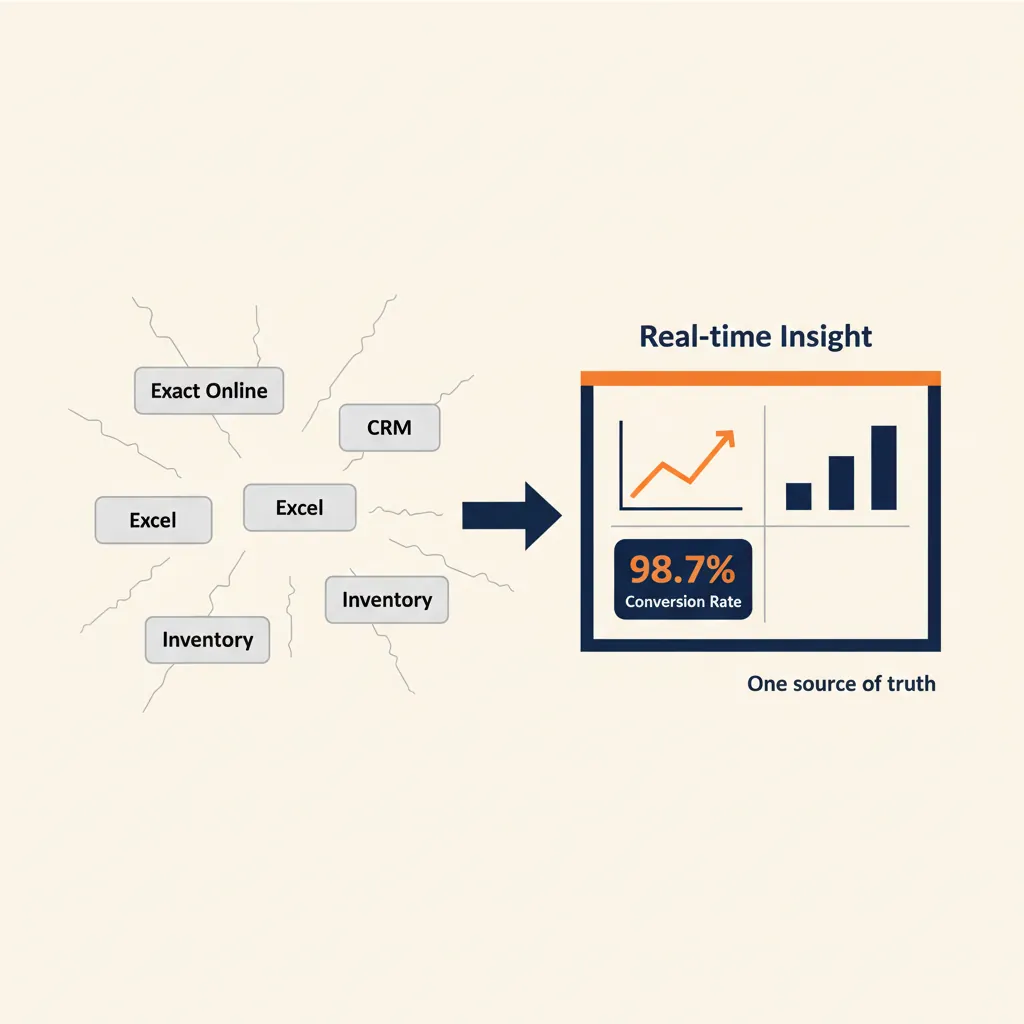
Your company data lives in Exact Online, your CRM, a few Excel sheets, and maybe a separate tool for inventory or projects. A custom-built dashboard brings those sources together in one real-time view, so you can see where you stand and where your attention is needed in five seconds. For Dutch SMEs running tools like AFAS, Exact Online, Moneybird, or Snelstart, a maatwerk dashboard eliminates the weekly ritual of copying numbers between systems and asking yourself whether the spreadsheet is still up to date. In the projects we deliver for Dutch SMBs, we see that the decision to build a custom dashboard typically comes after the third time someone makes a strategic call based on stale data. The question is not whether you need better insight, it is whether the time you spend hunting for numbers is worth more than the cost of automating that hunt.
Why a custom dashboard for SMEs (and when a standard tool is enough)
A custom dashboard solves one problem: scattered data. When your financials sit in your accounting package, your sales pipeline in a CRM, and your project hours in a time-tracking tool, every management decision starts with a manual treasure hunt. A dashboard pulls those sources into one screen, updates automatically, and shows the KPIs you actually care about.
What a custom dashboard delivers
- One source of truth: no more asking three people for three different versions of last month's revenue.
- Real-time insight: data refreshes hourly or daily, depending on your sources, so you always see the current state.
- No manual copy-paste: the dashboard reads directly from your tools via API or database connection.
- Custom KPIs: track the metrics that matter to your business, not the generic charts a SaaS vendor decided for you.
When a standard reporting tool is enough
If all your data lives in one system (for example, your CRM or accounting package), the built-in reports may be sufficient. Most modern SaaS tools offer dashboards that cover the basics: revenue over time, open invoices, sales funnel stages. Use those first. A custom dashboard makes sense when you need to combine data from multiple sources or when the built-in reports do not show the KPIs your business runs on.
When custom is the better choice
Build custom when you recognize these patterns: you maintain a master Excel file that pulls numbers from three other systems every week, you have to log into four different tools to answer one management question, or your team spends more time preparing reports than acting on them. For Dutch SMEs integrating AFAS with a webshop, a payment provider like Mollie, and a project-management tool, a custom dashboard is often the only way to see project margin, cash position, and outstanding invoices on one screen. The payback period is typically measured in weeks, not months, because the time saved on manual reporting adds up fast.
How the process works: from requirements to working dashboard
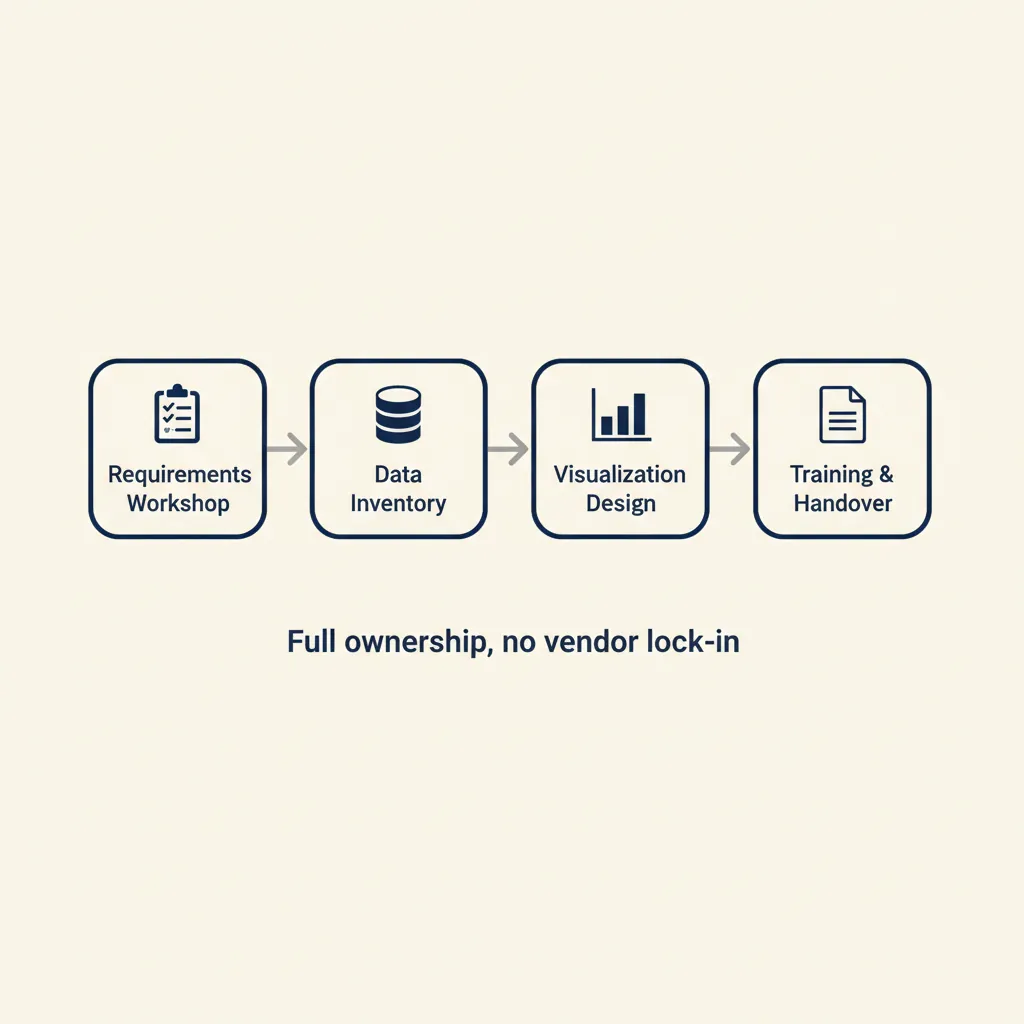
Building a custom dashboard follows four phases. We walk through each one so you know what to expect and what input you will need to provide.
Step 1: Requirements and KPI selection
The first conversation is about decisions, not data. We ask: what decisions do you make weekly or monthly that require up-to-date numbers? The answer defines which KPIs belong on the dashboard. Common examples for Dutch SMBs include project margin (revenue minus cost per project), cash runway (how many months until you run out of money at the current burn rate), and billable ratio (percentage of hours your team can invoice). We also ask who will use the dashboard and what questions they need answered. A financial controller cares about different metrics than a sales manager. The output of this phase is a prioritized list of KPIs and a rough sketch of the layout.
Step 2: Data inventory and integration
Next, we map where each KPI lives. Revenue comes from Exact Online, project hours from your time-tracking tool, customer data from your CRM. We check whether each source offers an API, a database connection, or an export that can be automated. For Dutch SMB tools like AFAS, Exact Online, Moneybird, and Snelstart, API connections are standard. If a source has no API, we build a scheduled import from CSV or Excel. We also decide where the combined data will live: in a data warehouse (for larger volumes) or directly in the dashboard tool (for simpler setups). This phase takes one to two weeks, depending on the number of sources and how clean the data is.
Step 3: Visualization and interaction
With the data flowing, we design the charts, tables, and filters. The goal is clarity: you should be able to answer your question in one glance. We use tools like Power BI, Tableau, or a custom web app, depending on your needs. Power BI is popular for its interactivity (click a project to drill down into its cost breakdown) and its ability to handle complex data models. A custom web app gives you full control over branding, mobile layout, and integration with other internal tools. We build a first version, you test it with real decisions, and we iterate based on feedback. Expect two to three rounds of refinement.
Step 4: Delivery, training, and ownership
When the dashboard is ready, we hand over full ownership. That means documentation of every data connection, the data model (how tables relate), and instructions for adding new charts or adjusting filters. We also offer training so your team can make small changes themselves, for example adding a new KPI or tweaking a color threshold. You own the code, the credentials, and the data. If you ever want to move to a different provider or bring development in-house, you can. No vendor lock-in, no opaque black boxes. This transparency is rare in the market and it is a deliberate choice: your business should not depend on one consultant staying available.
Integration with Dutch SMB software and GDPR compliance
For Dutch SMEs, the practical question is whether the dashboard can talk to the tools you already use. The answer is almost always yes, but the integration method varies. AFAS, Exact Online, Moneybird, and Snelstart all offer REST APIs that allow real-time data pulls. Mollie (for payment data) and most CRMs (Pipedrive, HubSpot, Teamleader) do the same. If a tool lacks an API, we can automate CSV exports or connect directly to the underlying database (with the vendor's permission). The key is that the dashboard reads from your systems; you do not have to manually upload anything.
Compliance is a blind spot in many dashboard projects. Under the GDPR (known in the Netherlands as the AVG), any tool that processes customer data on your behalf requires a processor agreement (verwerkersovereenkomst). We provide that agreement as standard. We also ensure that data is stored on EU servers (typically Microsoft Azure EU or AWS Frankfurt), that access is logged (so you can see who viewed which data when), and that you can export or delete all data on request. If your dashboard shows customer names, email addresses, or transaction details, these rules apply. Most competitors do not mention this, but it is a legal requirement and an audit risk if you skip it.
For SMEs in sectors covered by NIS2 (the EU cybersecurity directive that took effect in October 2024), dashboards that connect to critical systems must meet additional access-control and logging requirements. We build those controls in from the start: role-based access (so a sales rep cannot see financial data), audit trails, and optional two-factor authentication. The goal is that your dashboard passes an external audit without last-minute changes.
Running into this at your own business? We'll spend 30 minutes with you for free, no sales pitch. Book a free intro call
AI-enhanced dashboards: from insight to action
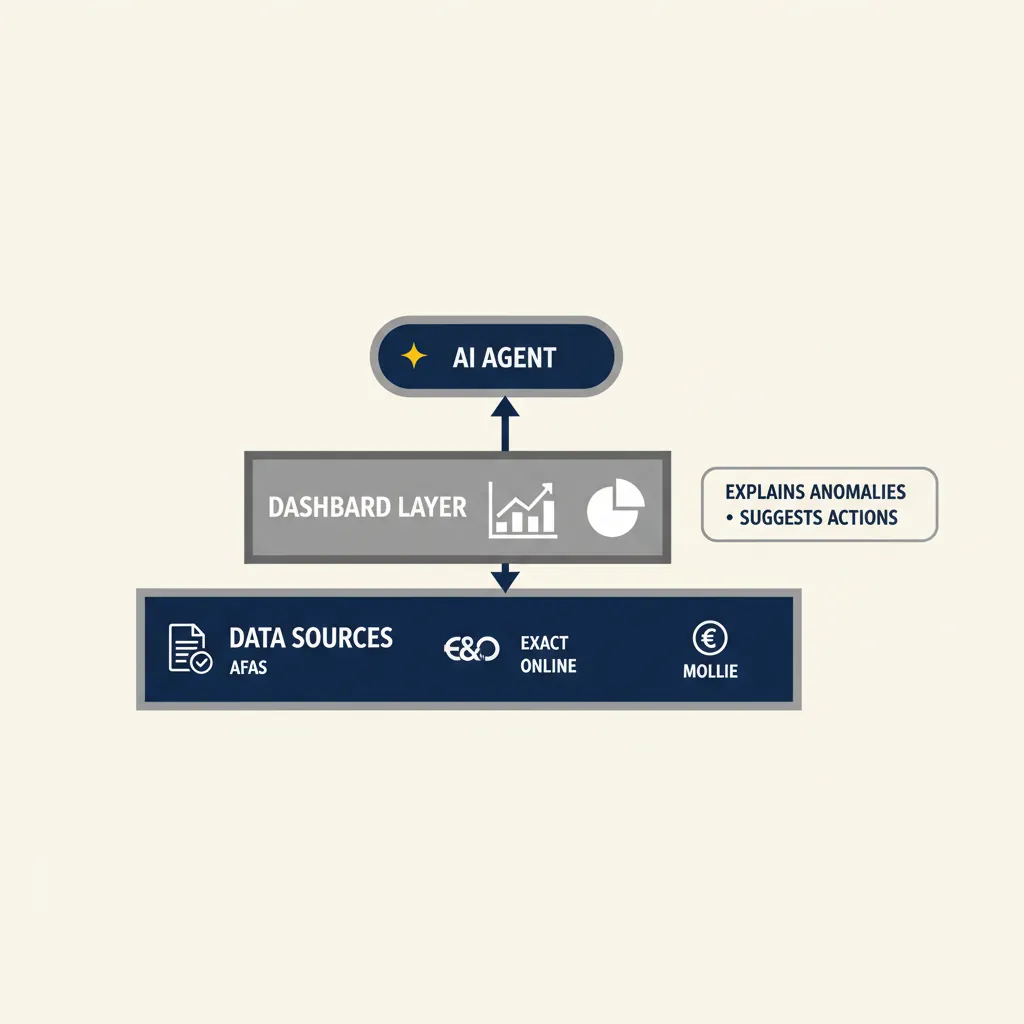
A traditional dashboard shows you what happened. An AI-enhanced dashboard explains why and suggests what to do next. This is where our work differs from most dashboard builders: we combine real-time data with AI agents that act on that data.
An AI agent that explains anomalies
Imagine your dashboard shows that project margin dropped 8 percentage points last month. A standard dashboard stops there. An AI agent can read the underlying data (timesheets, invoices, cost allocations), compare it to previous months, and generate a plain-language explanation: "Margin dropped because Project X ran 12 hours over budget and Client Y paid 3 weeks late, increasing your working-capital cost." The agent uses a GPT model to parse the numbers and write the summary. You get the insight without having to drill into five different tables yourself.
We build these agents for Dutch SMBs who want their dashboard to do more than display charts. The agent can also send a weekly summary email to your management team, highlighting the three metrics that moved most and flagging anything that crossed a threshold you care about. This turns passive reporting into active monitoring.
Automatically trigger actions based on your data
An AI-enhanced dashboard can also trigger workflows. For example, if your cash runway drops below two months, the dashboard can automatically send a reminder to your finance team to chase overdue invoices, or it can generate a list of clients with outstanding payments and draft follow-up emails. If a project goes over budget by more than 10%, the dashboard can notify the project manager and suggest reallocating hours from another project. These triggers live in our business automation platform (n8n or Make), connected to the same data sources as the dashboard. You define the rules once; the system enforces them every day.
This combination of dashboard and automation is unique to our approach. Most dashboard builders stop at visualization. We link the insight layer to the action layer, so your team spends less time reacting to reports and more time executing on what the data tells you to do. For a Dutch SME running Exact Online and a CRM, this might mean: dashboard shows low pipeline coverage for next quarter, AI agent drafts outreach emails to dormant leads, automation sends them via your CRM. One insight, three actions, zero manual steps.
What most dashboard builders get wrong (and how we do it differently)
We see three recurring mistakes in dashboard projects, and they explain why many custom dashboards end up unused six months after launch.
Mistake one: building without clarifying who needs which KPI. The result is a dashboard with 40 charts, half of which nobody looks at. The fix is to start with decisions, not data. We ask: what decision will you make differently if you have this number? If the answer is vague, the KPI does not belong on the dashboard. A good dashboard has 5 to 12 metrics, not 50.
Mistake two: ignoring data quality at the source. A dashboard can only be as accurate as the data it reads. If your CRM has duplicate contacts, your time-tracking tool has unassigned hours, or your accounting package has miscategorized expenses, the dashboard will amplify those errors. We spend time in phase two cleaning the data pipeline before we build any charts. Garbage in, garbage out is not just a saying; it is the reason most dashboards lose credibility within a month.
Mistake three: creating vendor lock-in. Many dashboard builders keep the data model, credentials, and transformation logic to themselves. When you want to make a change or switch providers, you discover you do not own the system you paid for. We deliver full documentation, access to all credentials, and optional training so you can adjust filters, add KPIs, or hand the project to another developer without starting from scratch. Transparency is not a nice-to-have; it is a requirement for a tool that will run your business for years.
In the web-app development projects we deliver for Dutch SMBs, we see that ownership and exit strategy matter as much as the initial build. A dashboard is infrastructure, not a one-off deliverable. Plan for the long term.
Conclusion
A custom dashboard gives you real-time insight into your business without manual copying between systems. Combine it with AI agents and you have not only an overview but also an assistant that flags anomalies and suggests actions. For Dutch SMEs running tools like AFAS, Exact Online, or Moneybird, the integration is straightforward and the payback period is measured in weeks. Want to know what a dashboard can deliver for your situation? Book a free consultation and we will map your data sources and KPIs in 30 minutes.
For a related angle, see our post on n8n vs Make for SMB: which platform fits your team?.
Frequently asked questions
What does a custom dashboard cost for a Dutch SME?
Cost depends on the number of data sources, complexity of the KPIs, and whether you need AI features or automation triggers. A basic dashboard connecting two to three sources (for example, Exact Online and a CRM) typically starts around €3,000 to €5,000 for the initial build, plus optional monthly maintenance. We provide a fixed-price quote after the requirements workshop so you know exactly what you will pay.
How long does it take to build a dashboard?
Three to five weeks from kick-off to delivery for a standard setup with two to four data sources. Complex projects with data-warehouse setup or custom AI agents can take six to eight weeks. The timeline depends on how quickly we can access your data sources and how many refinement rounds you need.
Can I adjust the dashboard myself later?
Yes. We deliver full documentation of the data model, all credentials, and step-by-step instructions for common changes (adding a chart, adjusting a filter, changing a color threshold). We also offer optional training so your team can make updates without calling us. You own the system, not just a license to use it.
Which data sources can be connected?
Any tool with an API, database access, or automated export. For Dutch SMBs, we commonly connect AFAS, Exact Online, Moneybird, Snelstart, Mollie, Pipedrive, HubSpot, Teamleader, and custom Excel or CSV files. If a source has no API, we build a scheduled import. The limit is not the tool, it is whether the data exists in a structured format.
Is my data safe and GDPR-compliant?
Yes. We store data on EU servers (Microsoft Azure EU or AWS Frankfurt), provide a processor agreement (verwerkersovereenkomst) as standard, log all access, and ensure you can export or delete data on request. If your dashboard shows customer names or transaction details, these steps are legally required under the AVG (Dutch GDPR). Most dashboard builders skip this; we build it in from the start.
What is the difference between Power BI and a custom web-app dashboard?
Power BI is a Microsoft tool with strong interactivity (drill-downs, filters) and a large ecosystem of connectors. It works well for teams already using Microsoft 365 and for dashboards that need complex data models. A custom web app gives you full control over branding, mobile layout, and integration with other internal tools (for example, triggering a workflow directly from the dashboard). Power BI is faster to build; a web app is more flexible. We recommend Power BI for most SMB projects unless you have specific design or integration requirements that Power BI cannot meet.
Curious what AI can do for your business?
We listen, think along, and quickly deliver something that works. No obligations, no pressure.